


Ukrainians in the UK
An overview of what is known about Ukrainians in the UK
Headline statistics
- According to preliminary estimates from the 2021 Census, the number of Ukraine-born individuals in England and Wales is 37,530
- Based on ONS population projections for England and Wales in 2021, this corresponds to 0.63 Ukraine-born per 1000 people
- The average age of Ukraine-born individuals in the UK is 41 (compared to 39 for the UK-born)
- Among Ukraine-born aged 16-65, 71.1% of them are employed (compared to 72.4% of the UK-born aged 16-65)
- 57% of the Ukraine-born in the UK are women (compared to 50.7% of the UK-born)
- 43.3% of employed Ukraine-born aged 16-65 in the UK hold a higher education degree (compared to 22.4% of the employed UK-born aged 16-65)
Where do existing Ukrainian migrants live in the UK?
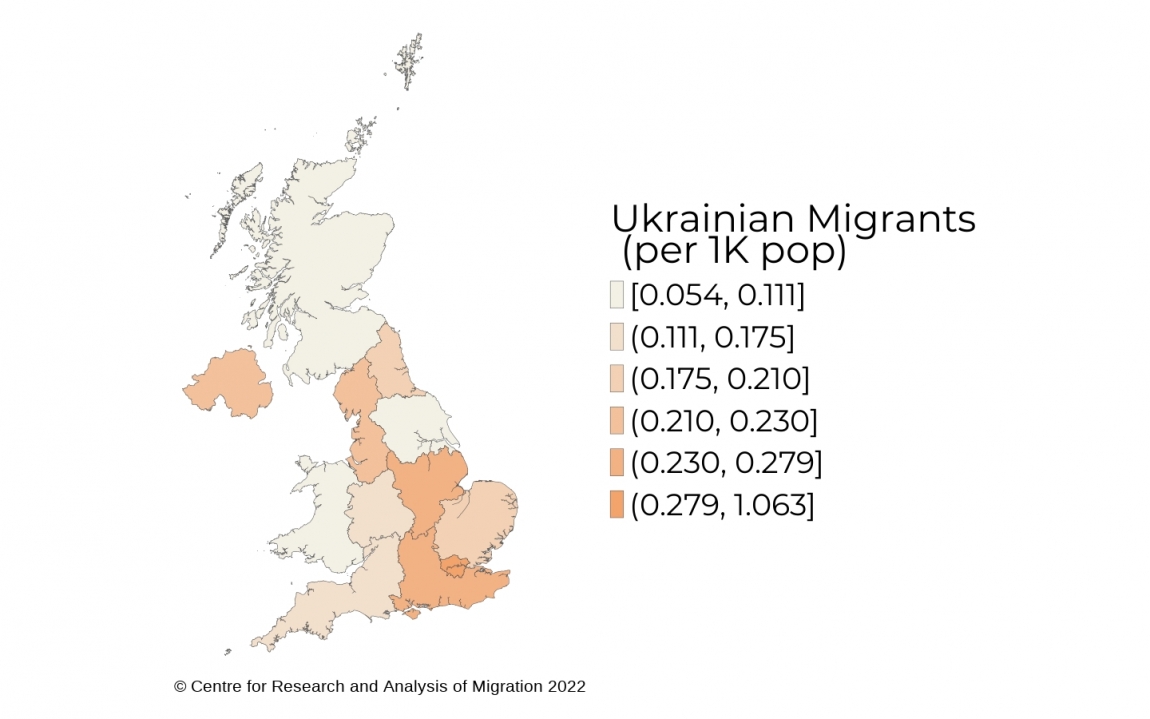
Sources and technical notes
Source: Own calculations based on UK Labour Force Survey (2003-2017). Estimates are computed by averaging across years 2003-2017. Ukrainian migrants are defined as individuals born in Ukraine.London is the region where most Ukraine-born individuals live (46%), followed by the South-East and the North-West of England which host, respectively, 12% and 9% of the total Ukrainian population in the UK.
What do we know about Ukrainians in the UK?
Based on our estimates from the UK LFS for the period 2003-2017, the number of Ukraine-born individuals in the UK is close to 283,300. The majority of them are concentrated in London (46%), in the South-East (12%) and in the North-West of England (8%).
Relative to the UK-born and to individuals born in Eastern Europe, the Ukraine-born are older with a larger share of women among their group. Relative to other foreign-born individuals in the UK, they have on average the same age and a greater share of women as well.
| Ukrainian Immigrants | Eastern European Immigrants | Other Immigrants | UK-born | |
| Mean age | 41 | 33 | 41 | 39 |
| % Younger than 18 | 8.5% | 11.8% | 9.6% | 23.2% |
| % Women | 57.0% | 52.0% | 52.2% | 50.7% |
Sources and technical notes
Source: Own calculations based on UK Labour Force Survey (2003-2017)Notes: Immigrant status is based on country of birth. “Eastern European Immigrants” are selected as the individuals born in the United Nations geoscheme’s subregion of Eastern Europe. They include individuals born in the Czech Republic, Hungary, Poland, Moldova, Romania, Belarus, Slovakia, Bulgaria and Russia. Estimates are computed by averaging across years 2003-2017.
The employment rate of the Ukraine-born in the UK is on average close to the employment rate of the UK-born and higher than the rate of other immigrants who were not born in Eastern Europe.
| Ukrainian Immigrants | Eastern European Immigrants | Other Immigrants | UK-born | |
| Employment rate | 71.1% | 80.5% | 66.1% | 72.4% |
| Female employment rate | 63.8% | 72.2% | 57.1% | 67.6% |
| Labour force participation | 79.0% | 85.3% | 72.9% | 78.8% |
| Female labour force participation | 73.2% | 77.3% | 62.3% | 71.4% |
Sources and technical notes
Source: Own calculations based on UK Labour Force Survey (2003-2017)Notes: Immigrant status is based on country of birth. “Eastern European Immigrants” are selected as the individuals born in the United Nations geoscheme’s subregion of Eastern Europe. They include individuals born in the Czech Republic, Hungary, Poland, Moldova, Romania, Belarus, Slovakia, Bulgaria and Russia. Estimates are computed averaging across years 2003-2017. Employment rate is computed as the ratio of the employed to the working age population (16-65). Labour force participation is computed as the ratio of the active (i.e. the sum of unemployed and employed individuals) to the working age population (16-65).
Workers born in Ukraine are on average more educated than the UK-born and the other Eastern European workers in the UK. They are mostly employed in wholesale and retail and in the real estate and renting industries. Significant shares of them also work in manufacturing, in financial intermediation and in health and social services.
| Ukrainian Immigrants | Eastern European Immigrants | Other Immigrants | UK-born | ||
| Education | % With higher education degrees | 43.3% | 23.5% | 32.6% | 22.4% |
| Average years spent in full-time education | 16.1 | 15.2 | 14.3 | 12.6 | |
| Sector | % Agriculture, forestry, hunting, fishing | 1.2% | 1.5% | 0.6% | 1.5% |
| % Manufacturing | 8.0% | 19.3% | 9.2% | 11.6% | |
| % Wholesale, retail & motor trade | 17.9% | 13.7% | 12.6% | 14.4% | |
| % Transport, storage & communication | 4.0% | 8.4% | 7.7% | 6.2% | |
| % Financial intermediation | 8.7% | 1.7% | 4.9% | 4.1% | |
| % Real estate, renting & business activities | 19.2% | 13.8% | 16.1% | 12.5% | |
| % Education | 5.9% | 3.6% | 8.3% | 9.9% | |
| % Public administration & defence | 1.3% | 1.1% | 4.5% | 7.0% | |
| % Hotels & restaurants | 7.6% | 11.2% | 8.6% | 4.2% | |
| % Health & social work | 8.4% | 7.9% | 16.0% | 12.7% |
Sources and technical notes
Source: Own calculations based on UK Labour Force Survey (2003-2017)Notes: Immigrant status is based on country of birth. “Eastern European Immigrants” are selected as the individuals born in the United Nations geoscheme’s subregion of Eastern Europe. They include individuals born in the Czech Republic, Hungary, Poland, Moldova, Romania, Belarus, Slovakia, Bulgaria and Russia. Estimates are computed averaging across years 2003-2017 and are based on employed individuals aged 16-65.
References
ONS Principal population projection - England and Wales summary
Census 2021 preliminary estimates of Ukraine-born population in England and Wales